A 3D configurator is a capital decision. It has a cost, it has an expected benefit, and the case for it should rest on arithmetic rather than on a vendor’s enthusiasm.
This article explains how that arithmetic works, which inputs actually drive the answer, and how to run the model on your own numbers. It also explains why we will not give you a projected ROI figure — and what we will give you instead.
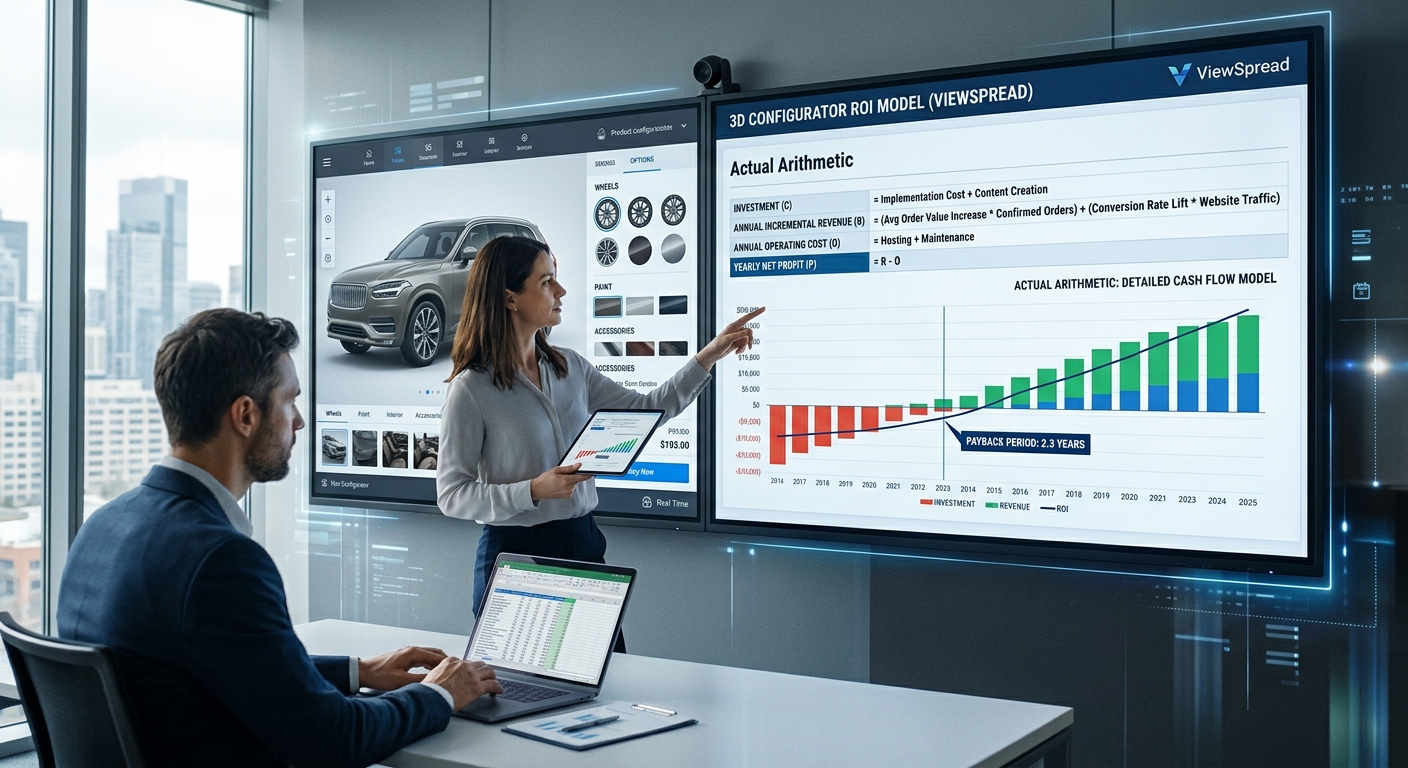
Why we do not publish a projected ROI
Vendor ROI pages tend to follow a recognisable pattern: a “typical” store, a “conservative” uplift percentage, a payback period measured in months. The problem is that the uplift figure is usually the vendor’s own estimate, presented with the confidence of a measurement.
We are not going to do that. We have no independently verified dataset of client outcomes that would justify publishing a projected conversion lift or return reduction, and a number invented to make a proposal look attractive is not an estimate — it is marketing.
What we can do is show you the arithmetic, tell you which inputs are uncertain, and let you run it against your own data. Then the resulting figure is yours, and its assumptions are visible.
The three levers
A configurator’s financial effect comes from three places. Every credible model has to address all three separately, because they scale differently.
Conversion. Some share of the visitors who currently leave without buying do so because they could not resolve a question about appearance, finish or configuration. If the configurator resolves that question, some of those visitors convert. The size of this effect depends on how large that share is in your traffic — which is the number nobody can tell you in advance.
Returns. A returned order costs you the outbound margin, the inbound logistics, inspection, and often refurbishment or markdown. If a configurator prevents some returns, the saving is cost avoided per prevented return × number of returns prevented. For bulky or high-value goods this lever alone can be substantial, because the cost per return is high.
Average order value. Configured and personalised products often carry a higher order value — an added module, an upgraded finish, an engraving. This lever is usually the most predictable of the three, because it is driven by your own option pricing rather than by buyer behaviour.
The inputs you need
Only five numbers are required, and four of them you already have.
| Input | Where it comes from | Reliability |
|---|---|---|
| Monthly sessions reaching product pages | Your analytics | Known |
| Baseline conversion rate | Your analytics | Known |
| Average order value | Your analytics | Known |
| Current return rate | Your analytics | Known |
| Cost per return (all-in) | Your finance data | Usually known |
| Share of traffic affected by configuration doubt | Estimated | Uncertain |
| Uplift assumptions | Estimated | Uncertain |
The first five are facts about your business. The last two are assumptions, and they are where every model becomes arguable. Anyone presenting a projected ROI without exposing these two is hiding the load-bearing part.
The arithmetic
The model is deliberately simple. It has to be, because complicated models create false confidence.
Incremental gross profit from conversion:
Sessions × configurable share × conversion lift × AOV × gross margin
Cost avoided from prevented returns:
Orders × return reduction × cost per return
Incremental gross profit from AOV uplift:
Orders × AOV uplift × gross margin
Add the three. Compare against build cost plus annual maintenance. The ratio gives you a payback period.
A worked example — explicitly hypothetical
To show the shape of the output, here is the model run with invented inputs. These numbers describe no client, no market and no outcome. They exist only to demonstrate the arithmetic.
Assume a store with 40,000 monthly product sessions, a 1.5% conversion rate, a $400 average order value, a 50% gross margin, a 12% return rate, and a $60 all-in cost per return. Assume — again, invented — that a quarter of traffic is affected by configuration doubt, that a third of those convert as a result, that returns fall by a fifth on configured products, and that order value rises 8%.
- Conversion: 40,000 × 0.25 × 0.33 × 1.5% ≈ 50 extra orders/month
- Those orders at $400 with 50% margin ≈ $10,000/month gross profit
- Returns prevented: 1,000 orders × 20% × 25% configured share ≈ 50 returns × $60 ≈ $3,000/month avoided
- AOV uplift: 1,000 orders × 8% × $400 × 50% ≈ $16,000/month gross profit
Total: roughly $29,000/month under these assumptions. Against a build cost of, say, $40,000 plus $3,000 annual maintenance, payback would land inside two months — if every assumption held.
That “if” is the entire point. Halve the conversion assumption and the total drops to about $24,000; halve everything and payback stretches well past a year. The model does not tell you the answer. It tells you which assumptions your decision depends on, which is more useful.
Where the external evidence can help
There is a small amount of attributable public evidence you can use to sanity-check your assumptions — provided you read it as what it is.
The National Retail Federation’s 2025 Retail Returns Landscape gives a defensible baseline for return rates: 19.3% of online sales returned in 2025, and 9% of returns fraudulent. If your own return rate is far above the online average, the returns lever is likely to be larger for you than for a typical store.
Shopify’s published merchant case studies give directional examples of what 3D and AR changed for particular brands — for instance, in the Rebecca Minkoff case study, shoppers who viewed a product as a 3D model were 44% more likely to add it to cart. These are individual merchant results in specific categories, published by Shopify. They are evidence that the mechanism exists. They are not a forecast of your results, and anyone using them as one is overreaching.
What we will give you instead of a projected ROI
Send us your five known inputs — sessions, conversion rate, order value, return rate and cost per return — along with how your catalog is configured. We will return:
- The model run on your numbers, with both uncertain assumptions shown explicitly so you can see how sensitive the answer is.
- An honest read on whether the case holds. If your traffic is too low, or your return rate too healthy, or your products insufficiently configurable, we will say so — sometimes the right answer is not to build.
- A scope estimate for the top products, so the cost side of the ratio is grounded rather than guessed.
We do not publish fixed prices or fixed timelines before scoping, because both depend on catalog size and rule complexity. A figure quoted before that is known would be fiction.
FAQ
How accurate is a model like this? The arithmetic is exact; the assumptions are not. Treat the output as a sensitivity map — it shows which assumption your decision rests on. Our configurator overview covers the mechanism in more depth.
What if I do not know my cost per return? Your finance data will have it, and it matters more than most people expect. Include outbound margin loss, inbound freight, inspection labour and any markdown or refurbishment cost. It is usually the number that decides whether the returns lever is worth pursuing.
Which lever usually dominates? It depends on the category. For bulky, high-value goods the returns lever is often largest. For heavily personalised products the AOV lever can dominate. Conversion tends to be the smallest and least predictable of the three.
Do you have client results you can share? We do not have an independently verified dataset we would be comfortable publishing as a performance claim. Rather than substitute a favourable estimate, we show the model and let you run it.
Can we test rather than forecast? Yes, and we would encourage it. Run the configurator against a control segment of your traffic for a defined period and measure the difference. That replaces the two uncertain assumptions with observed data — which is the only way any of these numbers becomes real.
Next step
The most useful thing you can send us is five numbers and a description of your catalog. We will run the model, show you where it is fragile, and tell you plainly whether the case holds.